DOLAR
36,6793$% 0.19
EURO
39,9272€% 0.26
STERLİN
47,4303£% 0.01
GRAM ALTIN
3.514,75%-0,08
ÇEYREK ALTIN
5.751,00%-0,29
BİTCOİN
3120476฿%4.70832
RİPPLE
87.39%3.50637
23:53 /
Worldcoin (WLD) Nasıl Alınır?
16:12 /
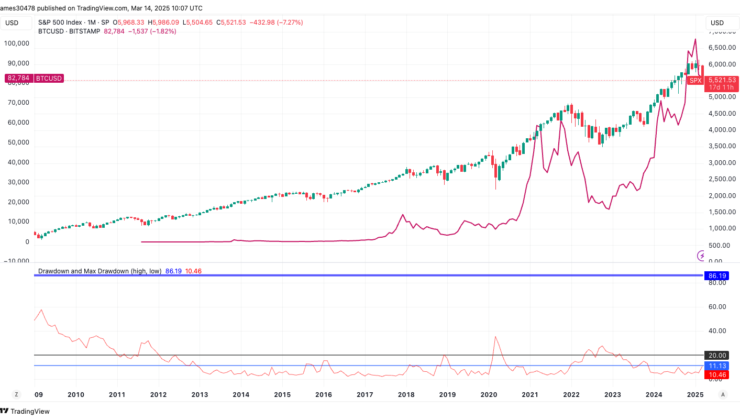
Bitcoin Yükselişe Devam Ediyor
11:53 /
Shiba Son Durum
11:44 /
Patek Hissesi
İmsak Vakti  02:00
02:00
02:00
İstanbul AÇIK 19°
- Adana
- Adıyaman
- Afyonkarahisar
- Ağrı
- Amasya
- Ankara
- Antalya
- Artvin
- Aydın
- Balıkesir
- Bilecik
- Bingöl
- Bitlis
- Bolu
- Burdur
- Bursa
- Çanakkale
- Çankırı
- Çorum
- Denizli
- Diyarbakır
- Edirne
- Elazığ
- Erzincan
- Erzurum
- Eskişehir
- Gaziantep
- Giresun
- Gümüşhane
- Hakkâri
- Hatay
- Isparta
- Mersin
- istanbul
- izmir
- Kars
- Kastamonu
- Kayseri
- Kırklareli
- Kırşehir
- Kocaeli
- Konya
- Kütahya
- Malatya
- Manisa
- Kahramanmaraş
- Mardin
- Muğla
- Muş
- Nevşehir
- Niğde
- Ordu
- Rize
- Sakarya
- Samsun
- Siirt
- Sinop
- Sivas
- Tekirdağ
- Tokat
- Trabzon
- Tunceli
- Şanlıurfa
- Uşak
- Van
- Yozgat
- Zonguldak
- Aksaray
- Bayburt
- Karaman
- Kırıkkale
- Batman
- Şırnak
- Bartın
- Ardahan
- Iğdır
- Yalova
- Karabük
- Kilis
- Osmaniye
- Düzce


 News
News


 Blog
Blog
 Blog
Blog
 Blog
Blog
 Blog
Blog
 Blog
Blog